| Home |
| Misc |
| Linux |
| TCP/IP |
| Windows |
| Random Daodejing |
| Photos |
Miscellaneous Things
Animal-Vehicle Collision Prevention w/ GIS / Virtual Reality Presentation Slides / Metropolis Ghost Town Documentary / Laboratory Information Management System / Buckminster Fuller Web Site / Record Database
Animal-Vehicle Collision Prevention
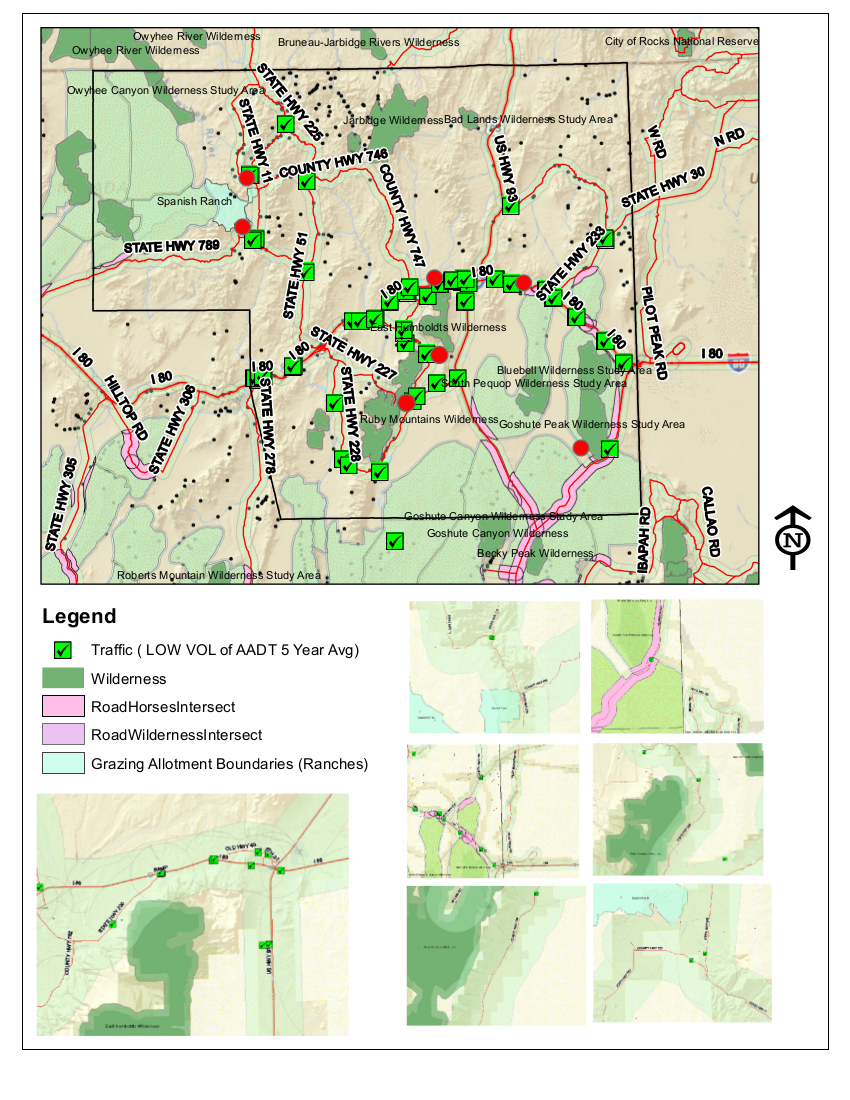
full map
I made a map to target areas where animal-vehicle collisions were more likely to occur in Elko County, Nevada. The results could be used to help reduce incidents, for example the target areas may serve as locations for constructing wildlife crossing bridges.
Data used includes defined areas from BLM, road information and traffic data from NDOT, and eco-region data from a Columbia University study.
Research notes
- According to "Animal Crash Trends 2008-2010,"
deer, cattle, and horses form the three predominant
animals involved in animal-vehicle collisions within Elko
County. This understanding leads me to conclude that
roads can be at risk from ranches as well as from
wilderness areas.
- According to a 2010 WSDOT research report, animal
habitat areas are significantly associated. Also,
proximity of wildlife areas to roads in rural areas should
be expected to have higher frequency rates of
animal-vehicle collisions.
- According to a 2008 Federal Highway Administration
report, wildlife-vehicle collisions have a higher
frequency on low-volume roads. Also, deer collision
locations in particular are associated with 'edge
habitat,' or transition areas.
Assumptions, criteria and project constraints
With this data in mind I am making several assumptions and
proposing the following criteria to find areas:
- Within Elko County
- On Public land
- Close to low-volume traffic roads, which have a higher
priority as areas of interest.
- Close to wilderness areas and particularly 'edge
habitat, ' or buffer zone.
- Close to ranches. (Definition query of "ranches" within
grazing allotment. This is a big assumption.
FFRs and "Ranches" as such are clearly defined, but other
possible ranches exists without "ranch" in the
title. Also, as FFRs wouldn't fall into the category
of "problem areas" they were not included. This was
eventually decided in light of providing a cursory example
of how this analysis could be used in a more extensive
study).
Process
The layers and datasets were filtered using definitional
queries to isolate specific attributes. To calculate
'LOWVOL,' a created field within the Traffic layer, the
following expression was used ("STANUM" LIKE '07-%' AND
"LOWVOL" < 200) which was derived from taking a 5 year
average sum based on annual average daily traffic (AADT)
data (from 2005 to 2009) and limiting results to traffic
counters within Elko. Initially a higher threshold
was used to reduce I-80 (potentially skewed due to so many
counters), but even at 200 it seemed conservative.
'Horses' was filtered down to simply just horses, as burro
generally occupy a significantly smaller rate of
animal-vehicle collision based on research.
The big assumption mentioned above concerning ranches had
to do with not being able to properly tease out all actual
ranches from the Grazing Allotment Boundaries data
(instead of "ALLOT_NAME" LIKE '%Ranch%' OR "ALLOT_NAME"
LIKE '%ranch%'), as this denotes a Federalized
jurisdiction which covers areas not strictly limited to
"ranches" as such. With further data it would
be possible to perform the same analysis for property
concerns (intersection between wilderness areas and
ranches, for example, and further road analysis).
A 0.5 mile buffer zone around wilderness and herd (horse)
areas combined with a 2 mile buffer zone for the road
seemed to provide the right kind of 'edge' zone I was
looking for. The constraints can be loosened to show
problem areas of secondary and tertiary importance.
Results and Conclusions
Seven locations were discovered which fit the
criteria. From this the analysis concludes that
these areas seem to be more likely than in other areas to
be subject to animal-vehicle collisions. The map,
though incomplete as it is given other factors and sources
of data which may make for a more complete survey,
nonetheless serves as a good starting point for developing
a more thorough framework around analyzing not only
animal-vehicle collisions, but other areas involving land
use, property, and wildlife.
Download
https://drive.google.com/file/d/1JaarYiwRr4JxqHu9sVEGdzVyLY_4UBEZ/view?usp=share_link (91.8 MB, ArcGIS)